Friday, 18 May 2018
Thursday, 10 May 2018
Wednesday, 9 May 2018
Apolosi's Statistical Literacy 1
Making Evaluations: Copymaster 1 Lunchtime Places
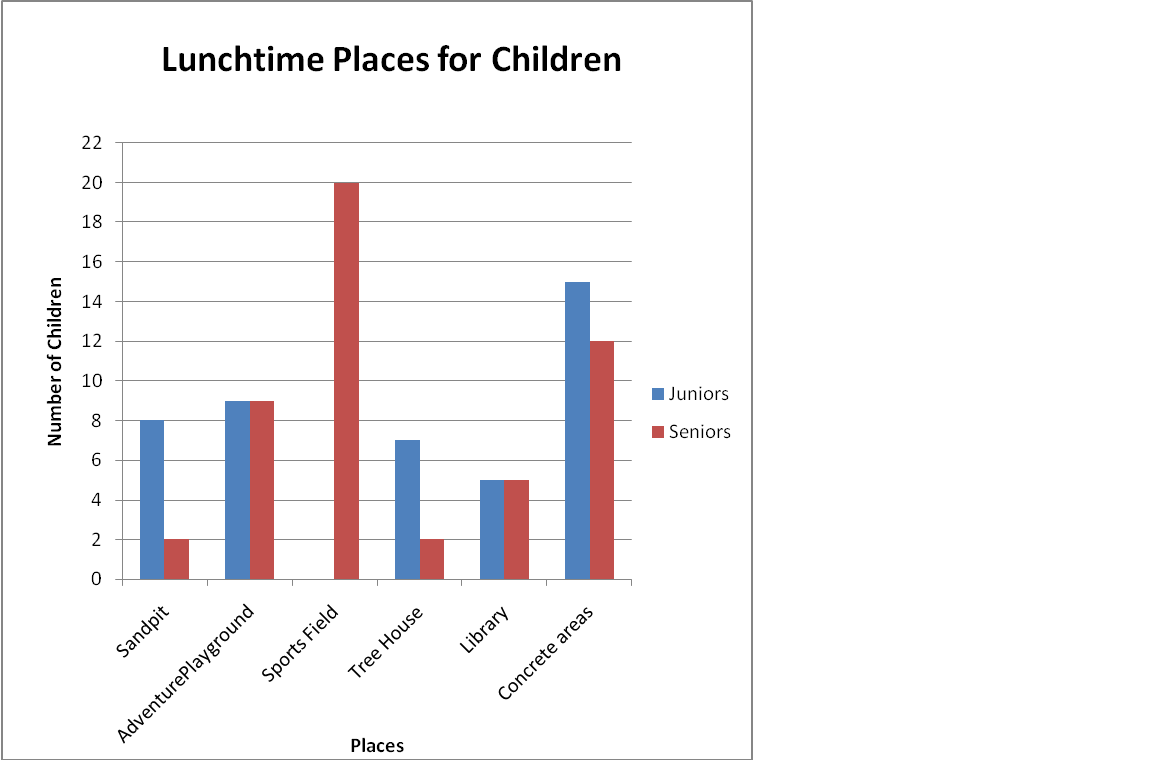
“The teachers at Sunshine school wanted to know where the most children play at lunchtime. After one lunchtime they asked all the children where they had spent most of the lunchtime and made a bar graph.
W.A.L.T:Analyse and discuss data displays.
After I was analysing the Data above I have found out that there were 94 children playing in the Lunchtime areas. There was a total of 44 juniors ad 50 senior students.
Subscribe to:
Comments (Atom)